Thickness Meshes
For analysis and visualization purposes, Dragonfly can compute and generate color-coded meshes showing the referential values of the local thickness between boundary points. Thickness is calculated as the diameter of a hypothetical sphere that fits within each boundary point.
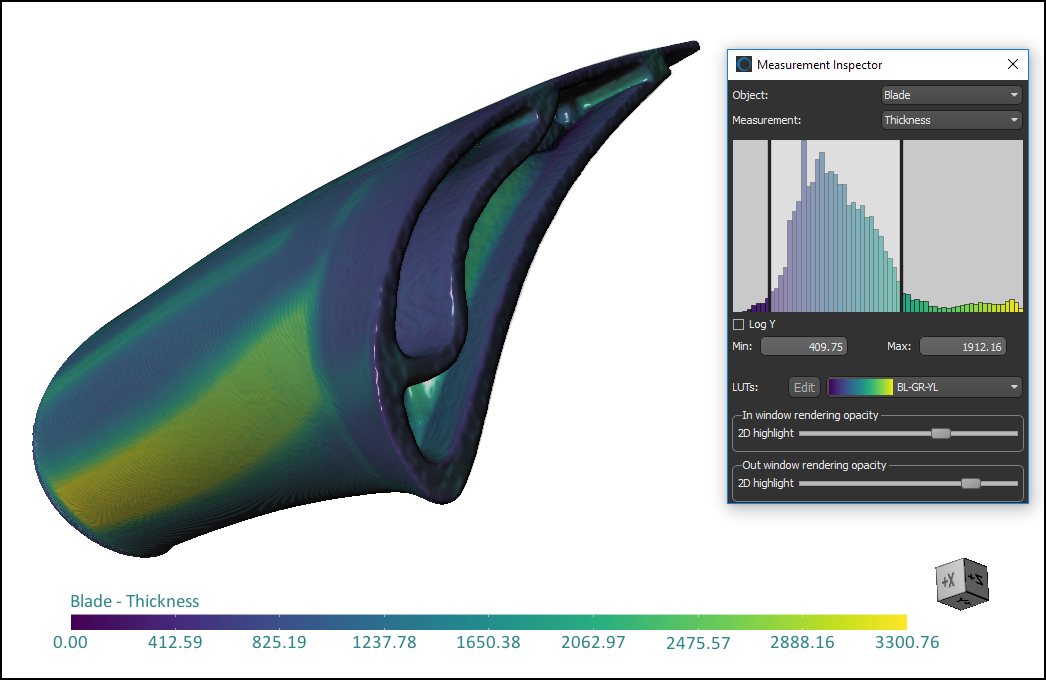
As shown in the illustration below, referential values are color-mapped according to the applied look-up table (LUT). Thickness meshes can be examined in 3D and 2D views.
Thickness mesh with scalar values
The measurements available in the Mesh scalar information box on the Data Properties and Settings panel include the minimum and maximum values of the local thickness.
| Description | |
|---|---|
|
Min |
Displays the minimum local thickness value for the mesh. |
|
Max |
Displays the maximum local thickness value for the mesh. |
Refer to the following instructions for information about computing thickness meshes from a region of interest.
- Create a region of interest that describes the surface you intend to export as the thickness mesh (see Segmentation).
- Select the region of interest in the Data Properties and Settings panel.
- Click the To a Thickness Mesh button in the Export group box on the ROI Tools panel.
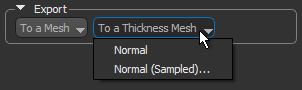
- Do one of the following:
- Choose Normal in the drop-down menu to export the mesh without sampling.
When processing is complete, the exported thickness mesh is added to the Data Properties and Settings panel.
- Choose Normal (Sampled) in the menu options to export the mesh with sampling.
The use of simplified models is one way to enable real-time, interactive visualization of large, complex meshes.
The Export as Sampled Mesh dialog appears.
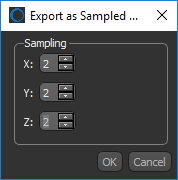
Select the sampling values for the X, Y, and Z axes and then click the OK button.
When processing is complete, the exported thickness mesh appears on the Data Properties and Settings panel.
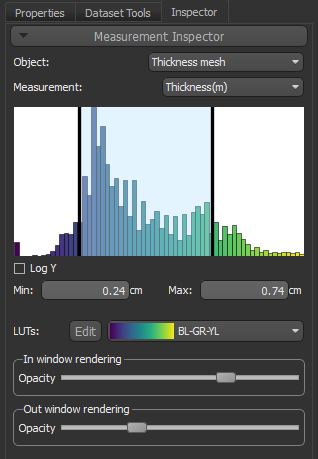
See Mesh Properties and Settings for information about making a mesh visible in a scene and about the settings available in the lower section of the panel. See Using the Measurement Inspector for information about inspecting the mesh with the help of the Measurement Inspector, shown below.
- Choose Normal in the drop-down menu to export the mesh without sampling.